
Hiring top talent when you need it is one of the most valuable functions for a business. While most people conceptually understand that great talent leads to great products, great marketing campaigns, and great companies overall, it can be hard to translate this value into terms that your CEO or CFO will need to justify investment of resources.
Table of Contents
- Hiring Budget efficiency—a clear path to direct cost savings
- Faster Hiring Velocity—the key to punctual onboarding and a more powerful workforce
- Net Hiring Score— better employees, better productivity, better outcomes
- Enterprise Logistics’ Hiring Success Scorecard— before and after
The Hiring Success metrics not only allow you to measure the performance of your function, they also empower you to translate your investment in talent acquisition (TA) into improved financial outcomes and overall business growth—we call this Return on Hiring (ROH).
In this article, we’ll discuss how you can leverage the Hiring Success Scorecard to build a business case for investing in your recruiting capabilities. For illustrative purposes, we’ll examine how Enterprise Logistics—a hypothetical North American company that specializes in global logistics and freight forwarding—boosted their ROH by investing in new CRM and AI screening technology.
While these new technologies cost the company $200,000, the team’s improved recruiting performance resulted in $450,000 in direct cost savings and $5,200,000 in improved workforce productivity for a total return of about $5,600,000!
Before we begin, let’s briefly recap each of the Hiring Success metrics.
Hiring Budget is the cost of recruiting new hires and is determined as follows: Recruiting Costs / New Hire Payroll. An organization’s Hiring Budget includes all recruiting costs, including all talent acquisition employees, job advertising, program spend, external recruiters, travel costs of candidates, and technology infrastructure.
Hiring Velocity measures one simple thing: The percentage of jobs filled on time. Why is this important? Well, it answers one simple question: Are we able to hire the people we need when we need them?
Net Hiring Score (NHS) measures the fit between new hires and jobs—similar to the Net Promoter Score (NPS), which measures customer experience. NHS is calculated like so: (Percentage of Strong fits – Percentage of Poor Fits) * 100.
Now, let’s start by taking a look at Enterprise Logistics initial recruiting data.
| Enterprise Logistics Company Profile | |
|---|---|
| Total employees | 2,500 |
| Annual revenue | $500M |
| Average annual revenue per employee | $200k |
| Annual new hires | 750 |
| New Hire Payroll (NHP) | $30M |
| Average NHP per employee (salary) | $40k |
| Total annual recruiting costs | $3M |
| Percentage of jobs filled on time | 50% |
| Percentage of new hires that are Strong Fits | 20% |
| Percentage of new hires that are Poor Fits | 20% |
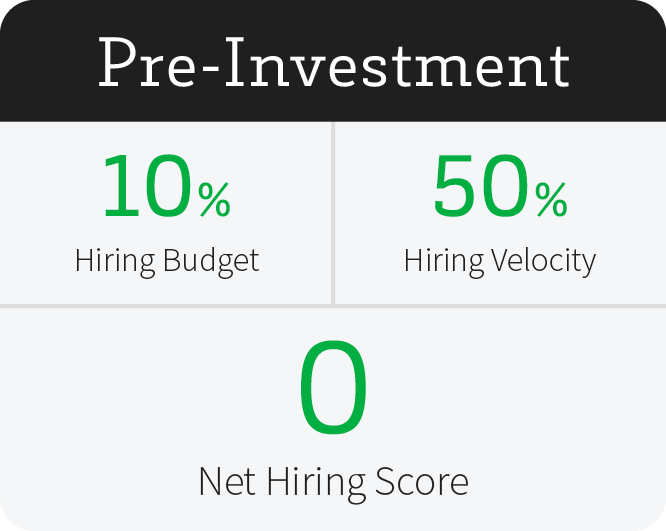
Based on this data, here’s what their initial Hiring Scorecard looks like:

Once again, here are the recruiting resources they invested in to boost their ROH:
| Capabilities Invested In | Costs |
|---|---|
| AI-Powered screening tool | $100k |
| Candidate CRM | $100k |
Hiring Budget efficiency—a clear path to direct cost savings
Leveraging their new CRM tool, Enterprise Logistics was able to save on sourcing costs by connecting with previously qualified candidates as opposed to heavily relying on job boards. They were able to reduce their job advertising budget by $150,000 for the year.
In addition, recruiters were able to process candidates faster with their AI-powered applicant screening tool. This allowed them to pore over thousands of resumes and quickly create a short-list for their hiring managers. What previously took hours now only took minutes. As a result, the recruiters did not have to rely on external recruiting agencies as much to manage the workload, saving them another $300,000 in annual fees.

With the $450,000 they saved (a 1.5% improvement on their Hiring Budget), they are now able to invest in other parts of their talent attraction strategy, such as branding, career sites, and so forth—all of which will differentiate & improve their employer brand against the competition
Faster Hiring Velocity—the key to punctual onboarding and a more powerful workforce
Enterprise Logistics has historically had a challenging time filling the roles they need on time. In fact, with a Hiring Velocity of 50%, only half of their job openings were filled on time—when they needed additional employees to alleviate increased workloads. For the other 50% of their job openings, there was a delay of approximately 20¹ days between the target start date and the actual date the role was filled.
As a result, despite increasing demand for their services, which would normally be a sign of positive business outlook, this actually led to many of their employees feeling overburdened and many upset customers who were disappointed with delayed service.
This prompted the company to invest in improving their hiring cadence. And they found a solution with their newly invested CRM and AI-Screening tool.
With CRM, they did not have to wait as long to find quality applicants and candidates; they already had talent pools that they could immediately engage with. In addition, with their AI screening tools, recruiters were able to process candidates faster and deliver them to hiring managers and interviewers on time.
There were several other factors that contributed to the bottleneck in Hiring Velocity including an outdated and clunky application process, misalignment between recruiters and hiring managers, and a poorly monitored candidate pipeline.
Once Enterprise Logistics tightened the bolts, so to speak, of their hiring process, they were able to increase their Hiring Velocity from 50% to 60%. This improvement meant that 75 new hires could start on schedule as opposed to being delayed by ~20 days. And considering that the annual revenue generated per employee at Enterprise Logistics equates to $200,000, organizational productivity increased by around $820,000.

Net Hiring Score— better employees, better productivity, better outcomes
Finally, the most significant impact on Enterprise Logistics’ ROH came from improving their Net Hiring Score (NHS). With CRM, they were able to leverage a talent pool of pre-vetted, strong performing candidates that were likely to become Strong Fits new hires in the organization. Similarly with AI screening, the tool was able to find high quality matches at scale, creating a short list of vetted candidates.
To be more specific, the company elevated 3% of their new employees from being Poor Fits to Moderate Fits, and another 3% from being Moderate Fits to Strong Fits. As shown below, that translated to a six point improvement in the organization’s NHS.

Considering that Poor Fits cost organizations, on average, double the cost of their salary and Strong Fits generate four times² the value of their salary, the overall financial impact translated to around $5,200,000 (see below).


More concisely put: since Enterprise Logistics invested $30 million in new hire payroll to scale its capabilities, it expects these employees to generate at least $30 million in value for the company (if not more). However, since they were able to attract more Strong Fits than Poor Fits, the value they received from their investment actually exceeds $30 million. In this case, $5.2 million more in value.
Enterprise Logistics’ Hiring Success Scorecard— before and after
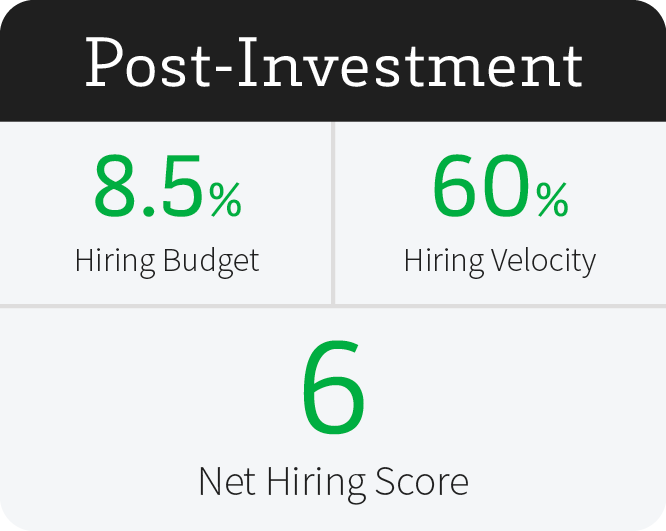
Initially, Enterprise Logistics had a Hiring Budget of 10%, a Hiring Velocity of 50%, and a NHS of 0. After investing $200,000 in upgrading their recruitment tech stack and hiring process, they lowered their Hiring Budget to 8.5%, increased their Hiring Velocity by 60%, and boosted their NHS by 6 points. This improvement in their Hiring Success Scorecard translated to $450,000 in direct savings and another $5,200,000 in productivity gains for their entire organization.
| Enterprise Logistics | |
|---|---|
| Direct savings | $450k |
| Productivity gains | $5.2M |
Conclusion
The framework for calculating ROH outlined in this article is a powerful aid in demonstrating talent acquisition’s importance in achieving company wide objectives. When TA teams can empirically prove that they are an invaluable organizational asset—with the Hiring Success metrics—they have a greater chance of convincing executives to invest in their function, furthering not only the team’s success, but the company’s, too.
Citations
¹According to Indeed, the percentage of jobs remaining open after the following time periods is as follows:
- > 1 month: 100%
- 1-2 months: 56%
- 2-3 months: 40%
- 3-4 months: 33%
Using this distribution, we can estimate that 50% of jobs still remain open after about ~50 days. If we assume that most organizations attempt close open positions within 30 days, then we can reasonably assume that the average delay between target & actual start dates is about 20 days (50-30).
²High performer hire multiplier: 4.0;
- McKinsey Global Analytics: on average, high performers are 400% more productive than average ones
- Harvard Business Review authors Jack Zenger, Joe Folkman, and Scott Edinger, analyzed a database of 50,000 managers and found that top 10% leaders create 15x revenue created by the middle 80%. They also analyzed 24, 826 evaluations on 2,055 individual contributors & found that a top 10% individual contributor is 2x as productive as the middle 30-70% performer
- Low Performer multiplier: -2.0
- Harvard Business Review authors Jack Zenger, Joe Folkman, and Scott Edinger also found that bottom 10% leaders cost 4x the revenue created by middle 80% leaders.
- UNSW Business school research indicates that bad employees can bring down team productivity by 30-40%
 Enroll in the Master Class & earn 6 SHRM credits